Charles
Perkins
Center
or use
keys

About the project
The Charles Perkins Centre (CPC) is an Australian medical research institute, clinic and education hub that primarily focuses on diabetes, cardiovascular disease and obesity, as well as other related conditions. The Centre is affiliated with the University of Sydney and is located within the Royal Prince Alfred Hospital health precinct at the Camperdown campus of the university in Sydney, New South Wales. The Centre is named in honour of Charles Perkins, the first man of Aboriginal descent to graduate from the University of Sydney.
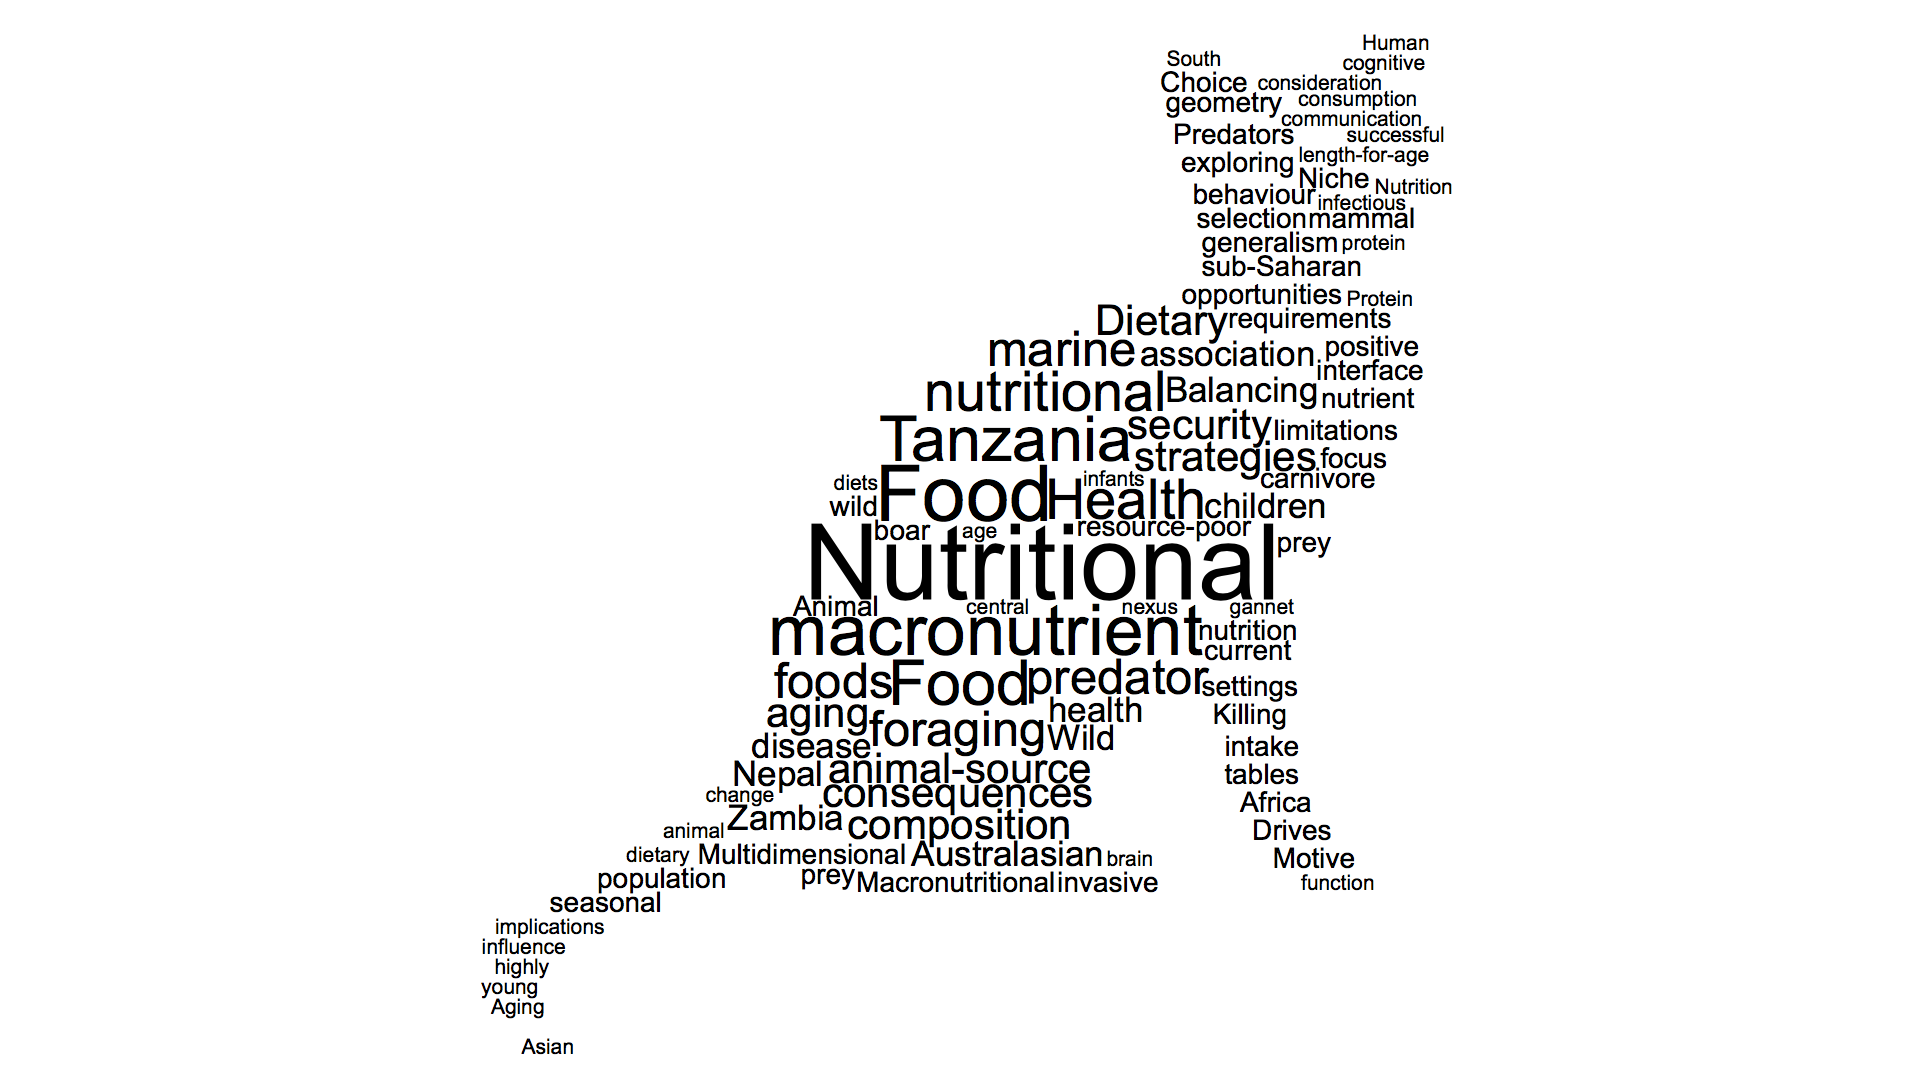
Below is an image depicting trends of School of Vetenary Science:
 The next steps are for each member to validate the information contained here including the scope and schedule, and reply in writing that the document has been understood and agreed to.
Deliverable,Extraction, Transfer and Loading (ETL) of several large data sources, generate a report that can be run to identify causal relationships and predict the requirements of the Charles Perkins Centre (CPC) hub moving into the future.
We expect over 6-7 (budget allowing) weeks of effort to provide a demonstrable statistical analysis, and the beginnings of a predictive model targeted at what the CPC usage will look like in 2-5 years.
The Project team are expecting the data to help answer the following questions:
Where are good ideas going to come from?
What is the predicted capacity for opportunity?
How do we build new Multi Discipline Research Centres (MDRC) to help them achieve in future?
How much will it cost to run the CPC into the future?
About the
project

Datasets
The dataset conatined in the project were as follows
• SharePoint Data
• Wi-Fi Data
• Publication
• Weather Data
• Search Data
• Track it Data
• Building Data
Following datasets were later included to help us achieve better results
• Archibus data
• Lab sundries
Following datasets were extracted from the Internet
• Weather Data
• Search Data
• No of Citations of each paper
Other tools that were used were
• LDAP3 search script: Used to find unikeys for members
The SharePoint Data consisted of the following tables:
• Research Activity
• Members
• Hot Desk User
• Desk Occupancy
• Access Request
Data Integrity
Data integrity is the maintenance of, and the assurance of the accuracy and consistency of, data over its entire life-cycle,and is a critical aspect to the design, implementation and usage of any system which stores, processes, or retrieves data. The term data integrity is broad in scope and may have widely different meanings depending on the specific context – even under the same general umbrella of computing. This article provides only a broad overview of some of the different types and concerns of data integrity.
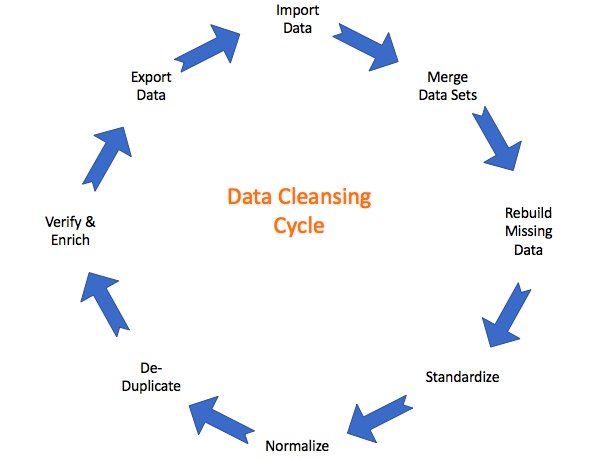
Data Cleaning
Data cleansing or data cleaning is the process of detecting and correcting (or removing) corrupt or inaccurate records from a record set, table, or database and refers to identifying incomplete, incorrect, inaccurate or irrelevant parts of the data and then replacing, modifying, or deleting the dirty or coarse data.
Data Pre-processing
For us to build our predictve model we had to extract several information from both our data and the internet. A part of the pre-processing is shown below
· Quantify the research output performance:
The number of paper is quite a biased measurement, so cannot use it alone.
Based on some research, calculate some index to measure the output.
O1 = ∑𝑊𝑖𝐼𝑖𝐴𝑖𝑛𝑖=1
𝑊𝑖 ={1,𝑖𝑓 𝑎𝑟𝑡𝑖𝑙𝑒 𝑜𝑟 𝑟𝑒𝑣𝑖𝑒𝑤0.5,𝑖𝑓 𝑛𝑜𝑡𝑒
(Actually this factor is not important, since almost of the paper are articles)
Ii: important factor of the journal
𝐴𝑖 ={1,𝑎𝑢𝑡ℎ𝑜𝑟 𝑜𝑟𝑑𝑒𝑟=10.5,𝑎𝑢𝑡ℎ𝑜𝑟 𝑜𝑟𝑑𝑒𝑟=20.25,𝑎𝑢𝑡ℎ𝑜𝑟 𝑜𝑟𝑑𝑒𝑟=3 0.1, 𝑜𝑡ℎ𝑒𝑟𝑠
O2 = ∑𝐶𝑖𝐴𝑖𝑛𝑖=1
Ai Same as above
Ci number of citations
· Merge data over different dataset:
Extract interested features from Research Output Dataset, Occupancy Dataset, Research Activity Dataset, Members Dataset and Wi-Fi usage Dataset.
· Removing outliers:
The outliers would cause “fake” relationship between dependent variables and independent variables
Datasets

Where are good ideas coming from?
In philosophy, ideas are usually construed as mental representational images of some object. Ideas can also be abstract concepts that do not present as mental images. Many philosophers have considered ideas to be a fundamental ontological category of being. The capacity to create and understand the meaning of ideas is considered to be an essential and defining feature of human beings. In a popular sense, an idea arises in a reflexive, spontaneous manner, even without thinking or serious reflection, for example, when we talk about the idea of a person or a place. A new or original idea can often lead to innovation.
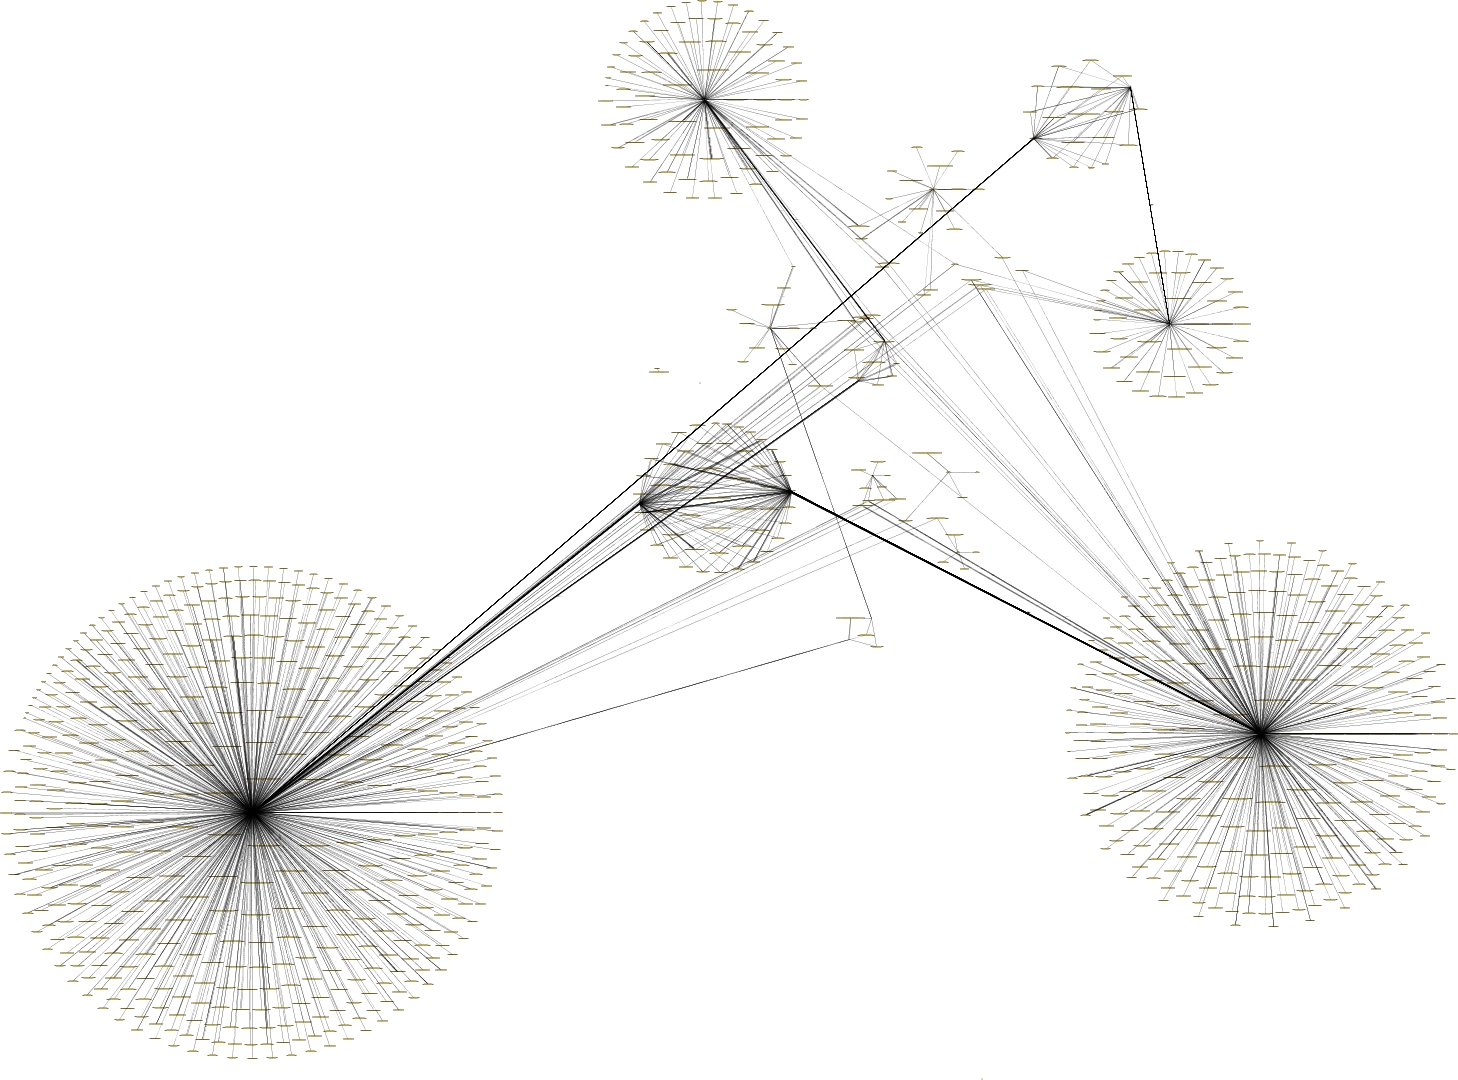
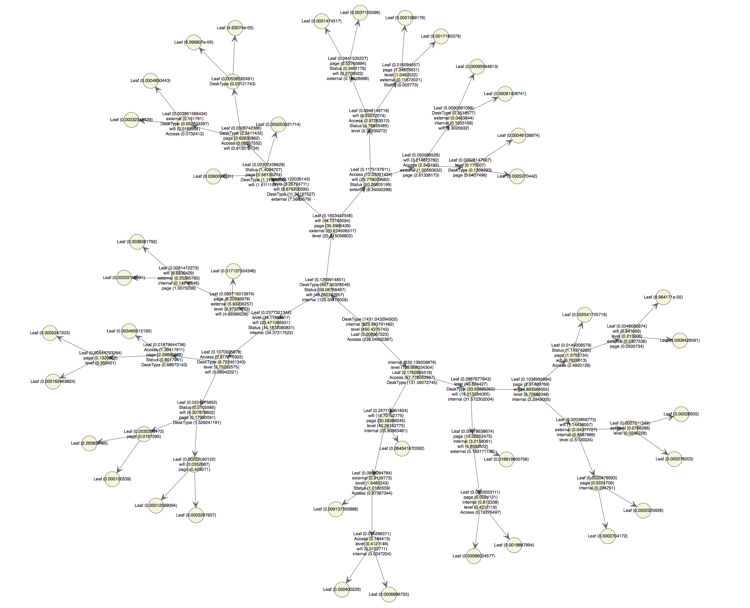
The above is a collaboration network of schools in terms of papers published.
Conditional Probability
Probability of number of papers conditional on the Desk type

*figures are only indicative
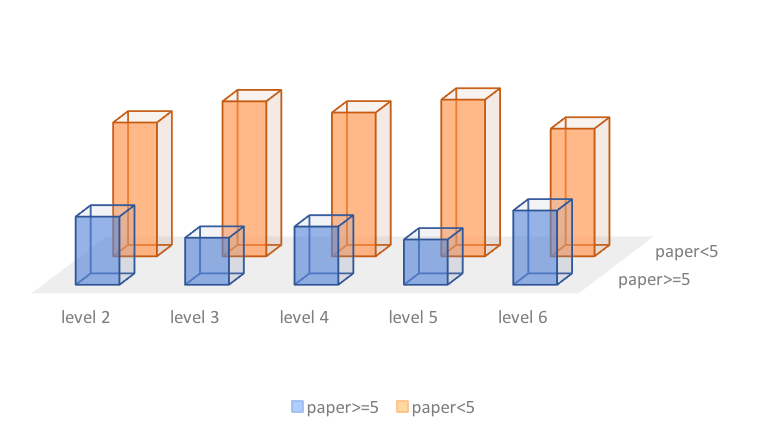
Probability of number of papers conditional on the Level
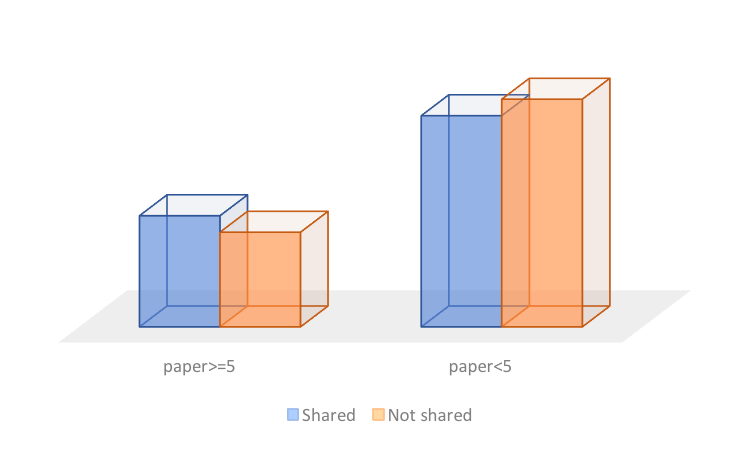
Probability of number of papers conditional on the Shared-or-not type
Analysis
1. Based on the conditional probability on each interested category, the difference between Prob(paper>=5|Small) and Prob(paper<5|Small) is near 77%, a really huge difference. The reasons might be that small tables are limited for collaboration and more students are assigned to the small tables.
2. From level aspect, level 2 and level 6 has little difference.
3. The difference between shared or not shared table is relatively small.
4. However, using number of paper as measurement does not include some factors, which would cause bias.
Probability of output performance conditional on the Desk Type

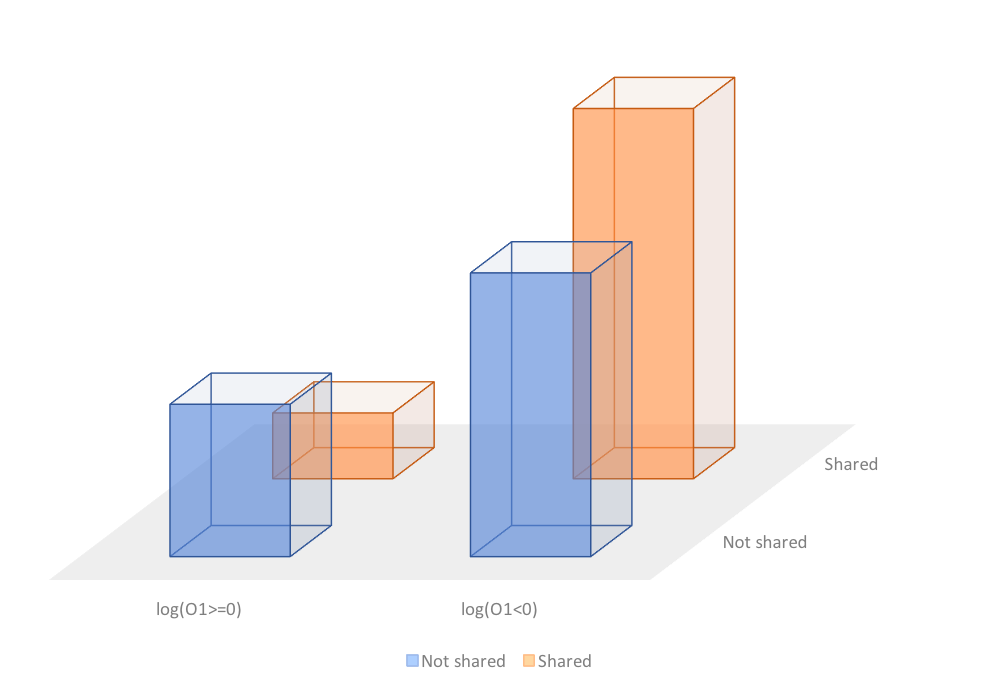
Probability of output performance conditional on the Shared or not shared type
Probability of output performance conditional on the levels

Analysis
The results right now changed a lot from the previous one, especially for the Desk type.
The Prob(paper>=5|Small) is the smallest, but Prob(log(O1)>=0|Small) is the largest. Similar situation for Office type.
The Prob(paper>=5|Office) is the largest in the previous table, but right now, Prob(log(O1)>=0|Office) is the smallest.
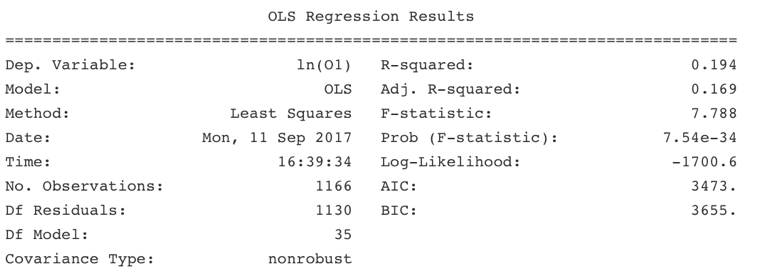
Linear Regression Model
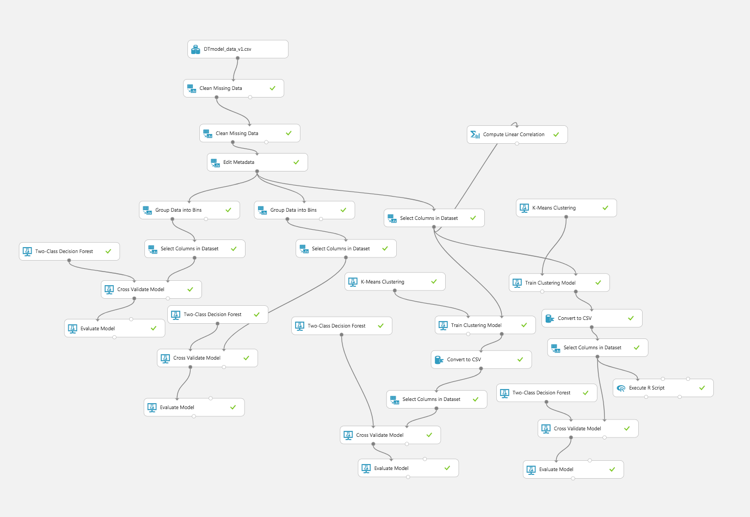
Workflow

1.Define Variables:
Dependent variable: ln(O1)
Independent variable: page number, ci, number of internal authors, number of external authors, SharedOrNot, Status, ResearchGroup, Faculty, Paper Categories, Desk Type, Level, withinuni_collab
2. Edit Metadata:
Standardising all the numerical variables.
Transform categorical variables into dummy variables.
3. Group categorical data:
Too many categories for some categorical variables, so group some categories into one.
4. Split dataset:
80% for training data, 20% for testing data
5. Result:
The accuracy score and the R^2 of the model is pretty low (The R^2 of some similar model is also pretty low, around 0.21)
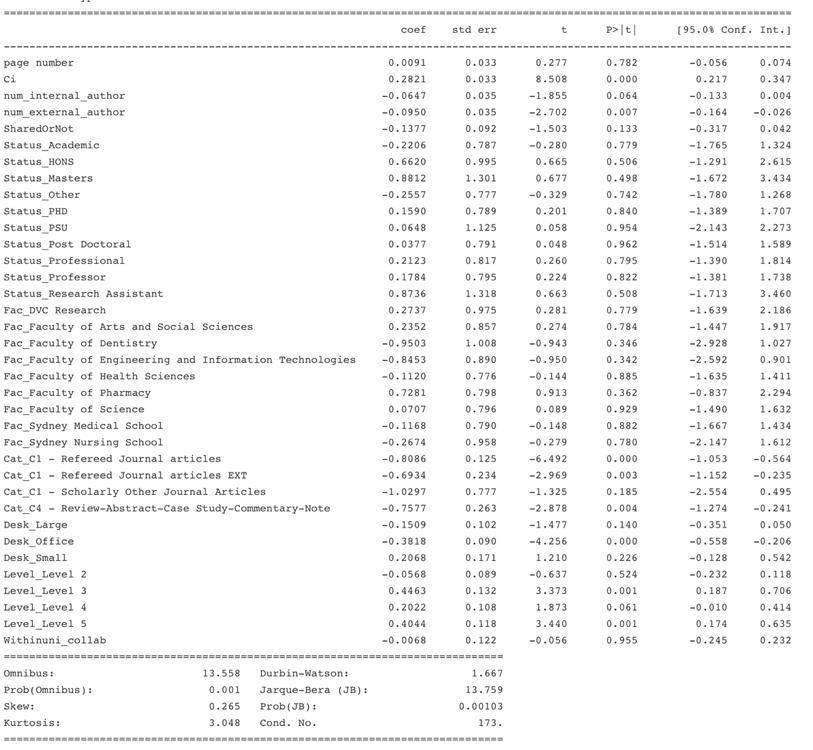
Correlation Plots
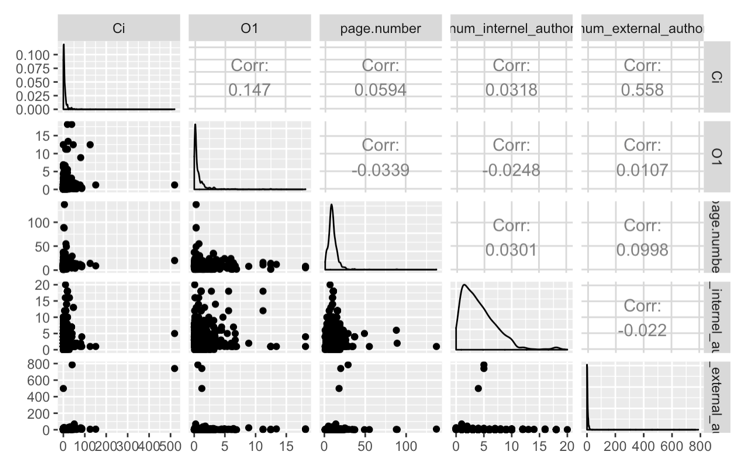
From the output below, Status, Faculty and withinuni_collab are most important variables. However, since the model performance is not good, the results do not explain so much. It’s hard to tell the correlation between the research output and the CPC centre.
Decision Tree classification model
This model is publication author based.
Workflow
1. Define variable:
The output of the model would be the classification of the O1 (output measurement index), the one with 0 would be classified as good output, the one with 1 would be classified as better output. When fit in the model, the variables that are used to do the clustering would be extracted from the dataset in case of overfitting.
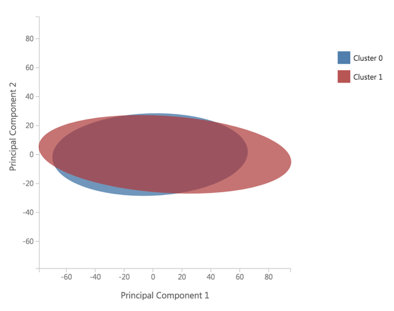
First try with the k-means clustering to get the auto assigned result:
• Plot the k-means clustering for the dataset, get the classification and labels for O1 and get the assignments label.
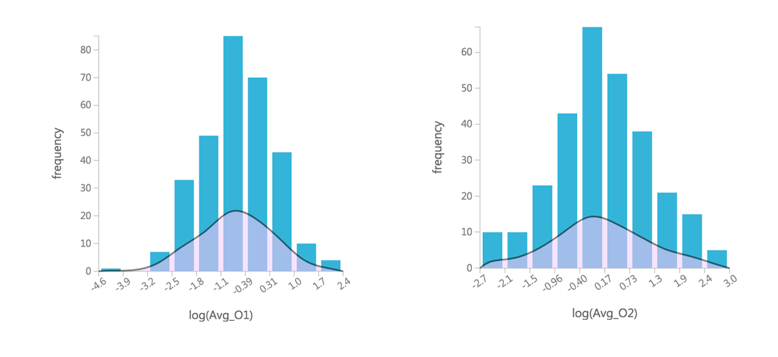
• Manually classified based on the combination look on O1 and O2. Log scale this two index and based on the density graph to make classification.
2.Results:
For the k-means one:
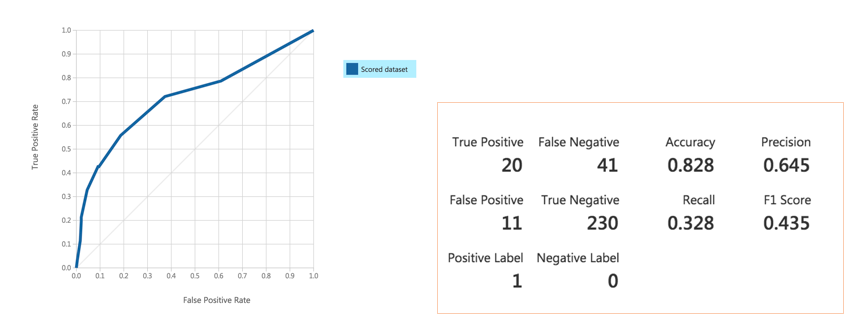
The accuracy is 82% which is fine, now, visualise the tree to find the path that would lead to the better output. (Would use c5.0 tree to plot this tree.)
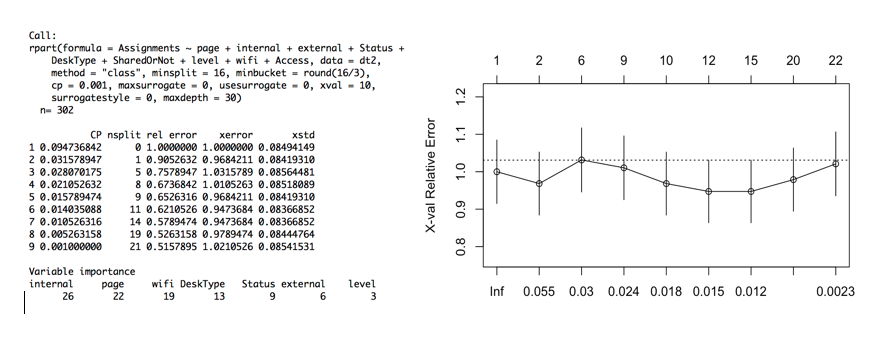
Now, take out Faculty and ResearchGroup variables. The Root node error rate is 31%.
The output shows the number of internal authors is the most important feature and level is the least important feature. (Depending on different algorithms, the result would be different)

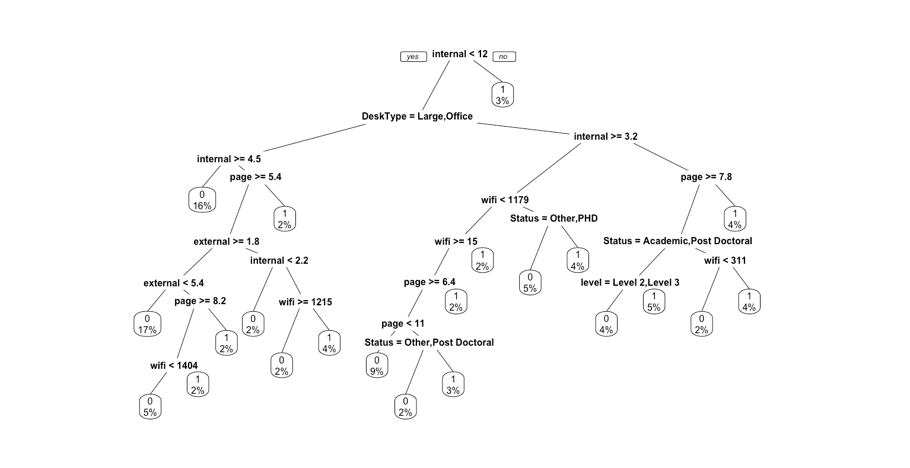
The first split node is on the number of internal authors, the reasons might be the clustering classification group all the number of internal authors > 12 into the better output clusters. There is only one node on the Desk Type (condition on the large and office type, the small and snowflake are excluded in this decision tree). Also, level only has one node as well (condition on the level 2 and level 3).
For the manually classification (with two classifications):
Now, the root error rate increases to 47%.

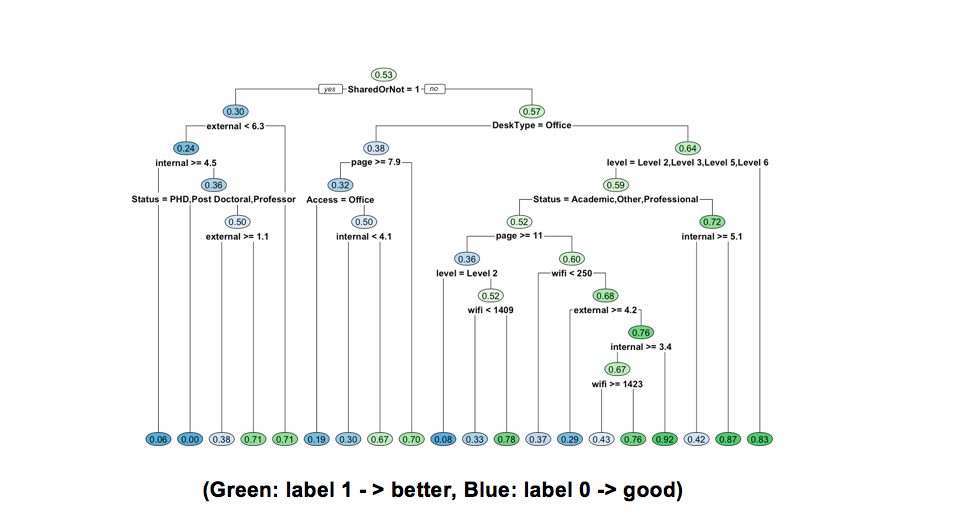
The first split node is at SharedOrNot. Most of the shared type go to the good output. For the not shared type desk, they first split node after that is DeskType. Office desk type would get a higher probability of getting better output. For non-office desk type, if the authors are in level 4, they have higher probability to get a better output.
More complex tree:
Only taking variables that are correlated with the building facility: Root error rate: 47%


If we only take consider of the categorical variables of the building facility, the error of this model is higher than before (However, something like this tree is what we expected). A very intuitive view of this tree is, not-shared type desk has more chance to generate higher output. The other results are very consistent with the conditional probability that we calculated before.
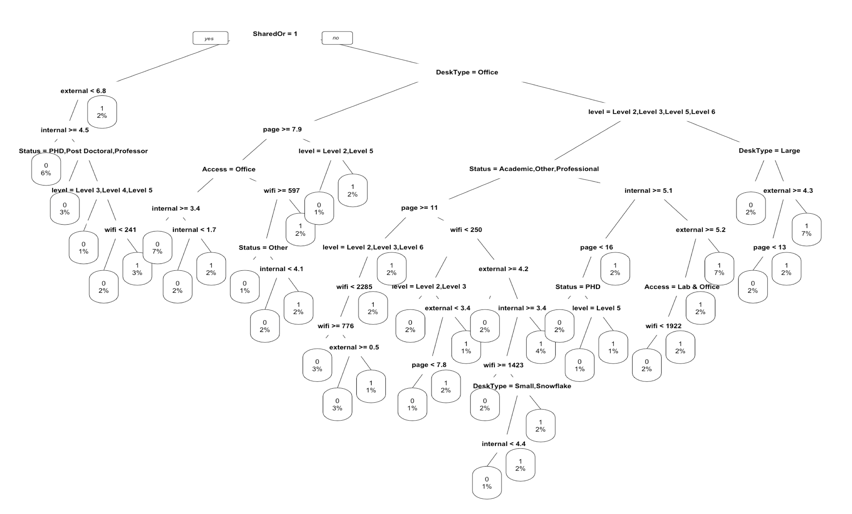
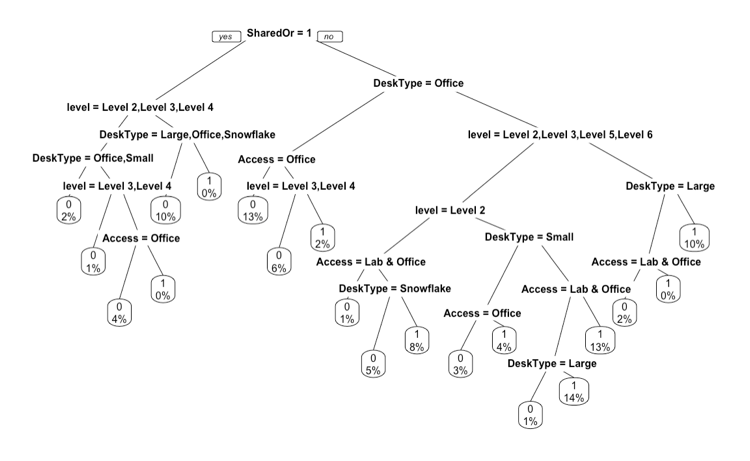
Manually classification (with three classifications):

Trying with C5.0 tree
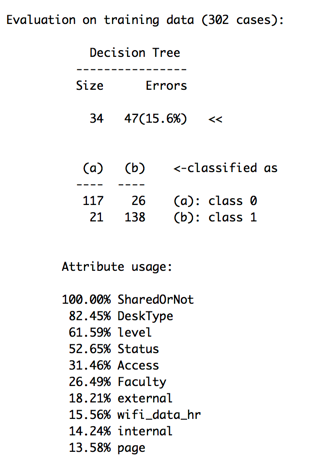
The accuracy is good, the attribute usages shows the Shared or Not, Desk Type, Level, Status are most used features in the tree.
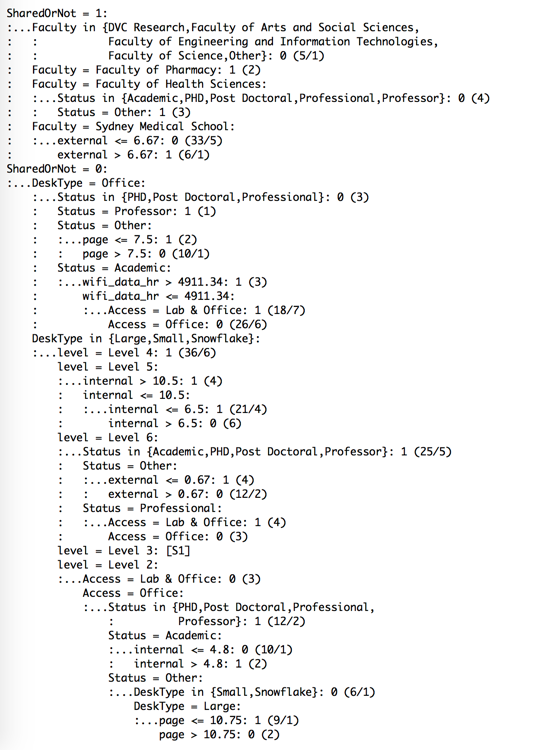
From this tree, we could find some path like:
Not Shared desk -> Office desk type -> Academic Status -> Wi-Fi usage <= 4911 hrs -> Lab&Office access
A general view of the paths is that level 4, level 6 and Office type desk would have higher probability to produce better quality research output, which is very similar to the condition probability results as shown before.
The idea using decision tree model is that decision tree would tell us the important features and also the tree visualisation could provide the nodes and paths which can help us see some relationship between the features and outcome.
But still, the output is not good enough. Most of the paths are not what we expected to be. Still, this model need to be adjusted and do the tree prune and definitely more data would help (include the length of the data and more features).
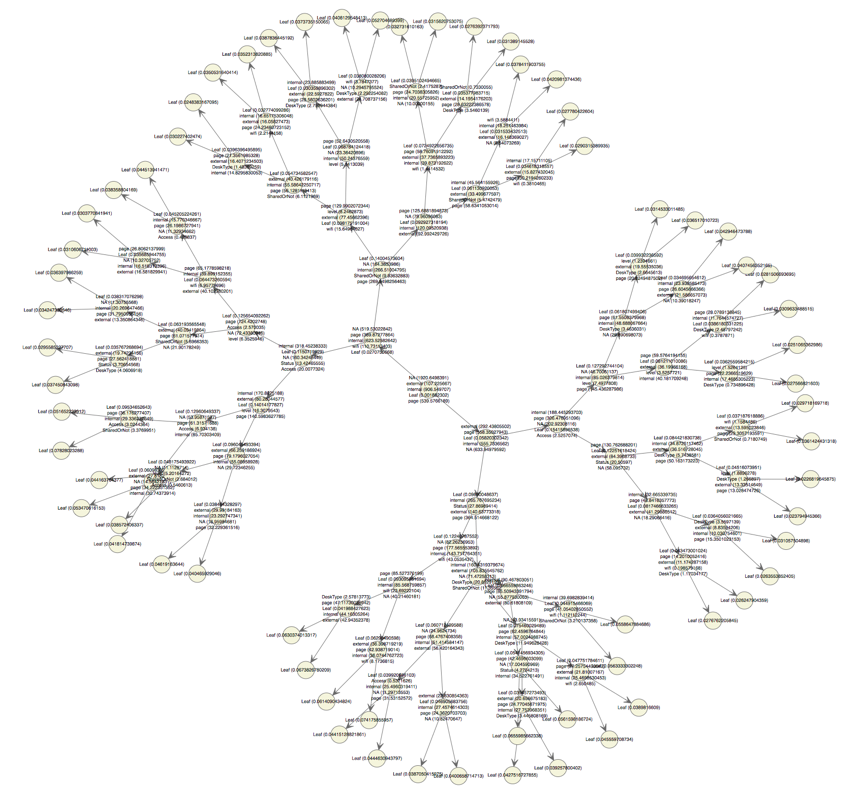
Random Forests Model
Random forests are composed of several decision trees and would provide stronger predictions.
1. Use all variables:
Assignments1, page, num_internal_authors,num_of_external_authors,
Status, DeskType, SharedOrNot, level, Wifi, Access.
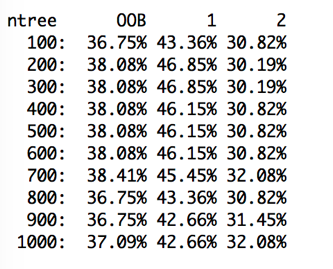
The out-of-bag error rate across 1000 trees
The Out-of-bag error rate of 1000 tress is 36.75%
The output shows that 1000 tress were built. At each split, 5 variables were assessed.
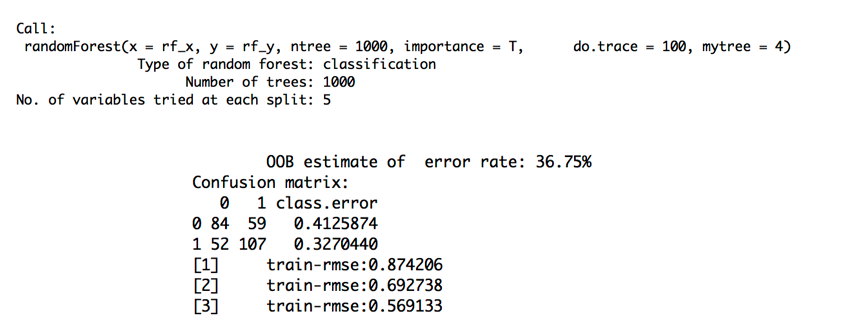
1. Just use facility related variables:
Status, DeskType, SharedOrNot, level, Access (The status is not exlucded)
The out-of-bag error rate across 1000 trees
The Our-of-bag error rate of 1000 tress is 37.09% and is slightly higher than before.
The output shows that 1000 tress were built. At each split, 4 variables were assessed.
Where are good ideas
coming from?

Predicted Capacity for Opportunity
Average monthly work request cost
The graph below is the monthly total work request cost against each month. During 2016 in CPC building, the August has the largest monthly work request costs, which is 14.94%. February has the lowest monthly work request costs, which is 4.23%.
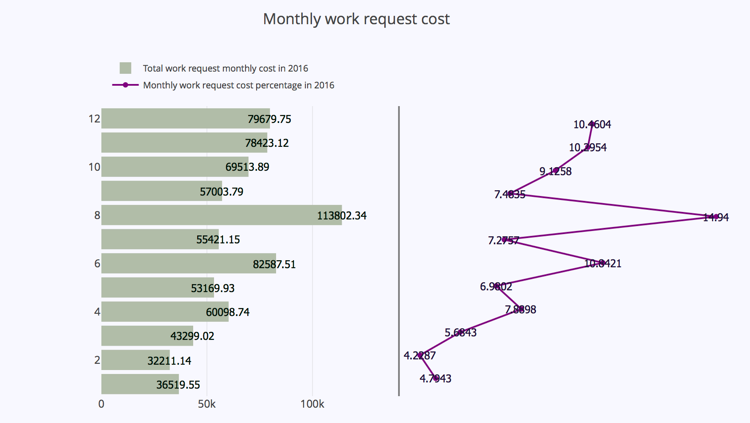
Another graph shows the average monthly work request costs against time. In this graph, December has the largest average monthly work request costs. February still has the lowest costs. However, the one with largest total monthly costs do not have largest average monthly costs. We can dig further on the problem type to see the reasons.

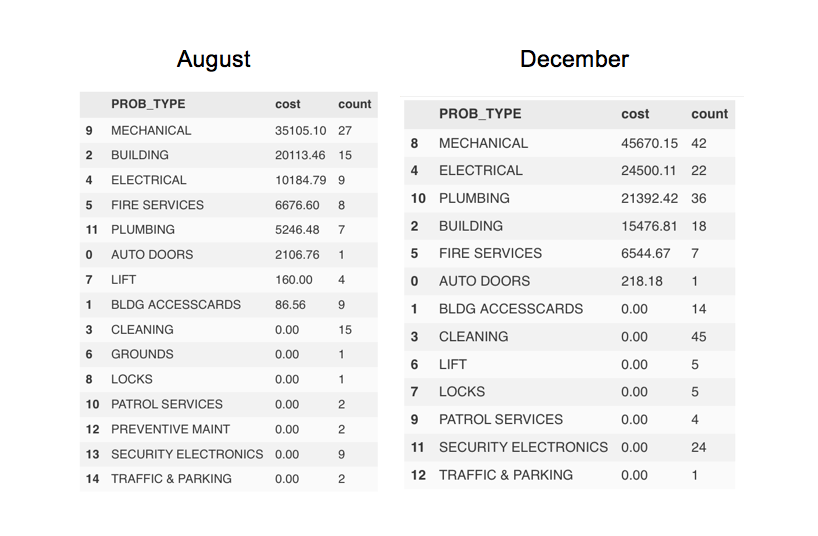
The count of Problem Type in August is much greater than that in December, thus the average costs in December is higher that August.
The graph below is an estimated trend for the monthly work requests costs.
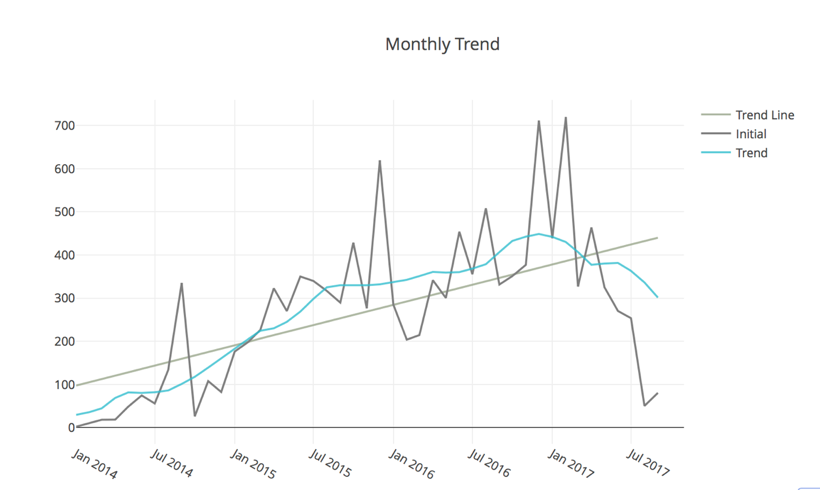
The blue trend line uses the rolling window method with window size = 12 after seasonal adjusted.
The linear relationship between the time and monthly total costs, which can capture the 33% of the trend.

Further can apply ARIMA, ARMA, MA models to make more precise prediction.
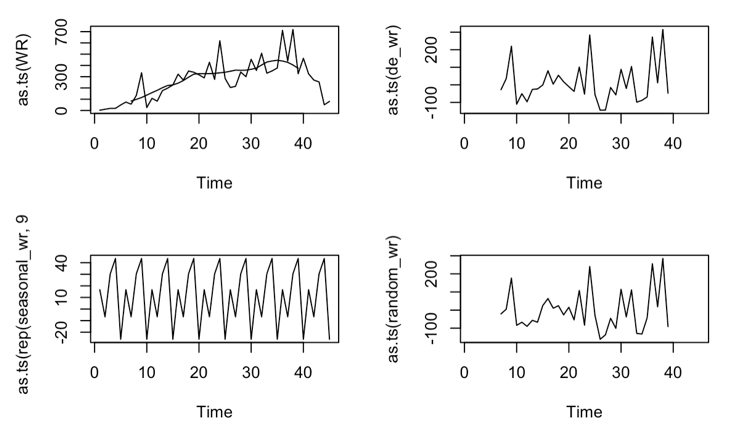
The decomposition of the monthly-average cost
First apply ADF test on the dataset.
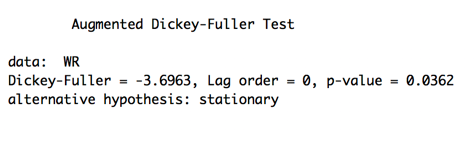
The result shows the p-value is 0.0362 which is less than 0.05. So we reject the null hypothesis at 5% significant level and conclude the dataset is stationary.
The ACF and PACF graph of monthly-average cost
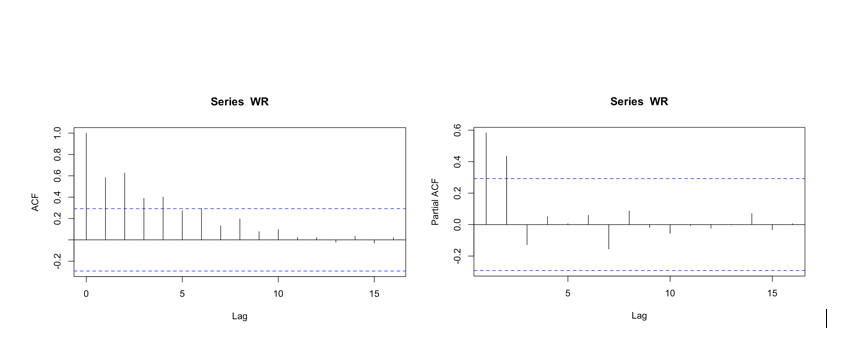
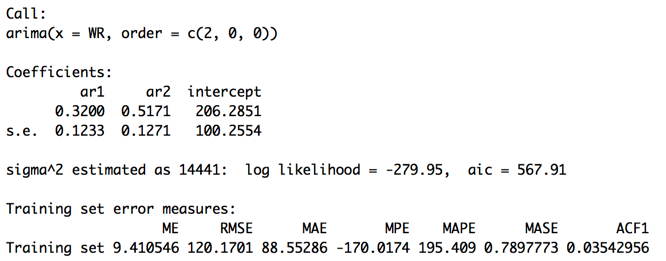
The ACF tail off. The cuts off of PACF graph is at lag 2. Based on this, we would apply AR(2) model.
Model summary:
 Forecast plot:
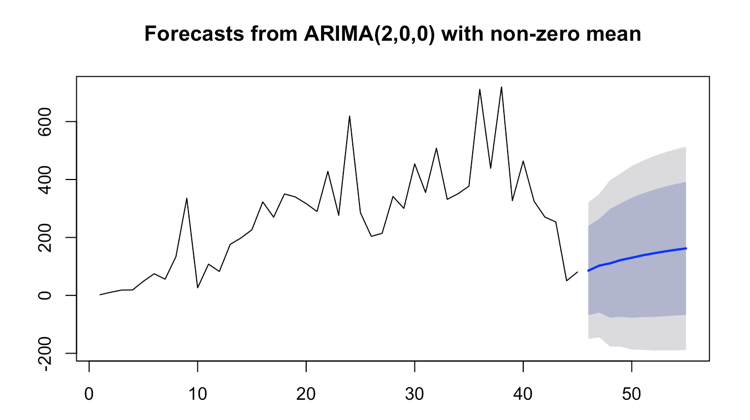
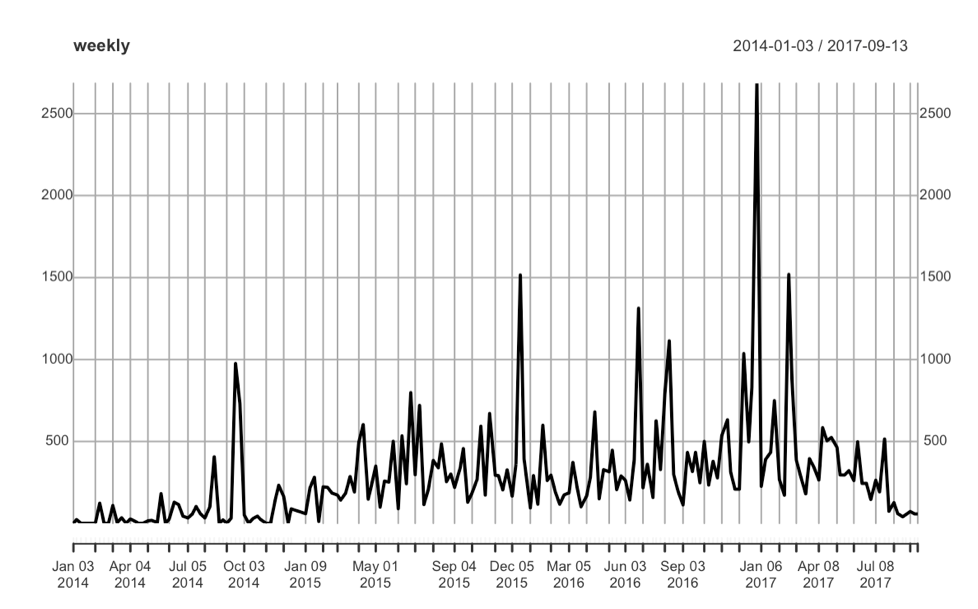
Average weekly work request cost
Weekly work request cost plot
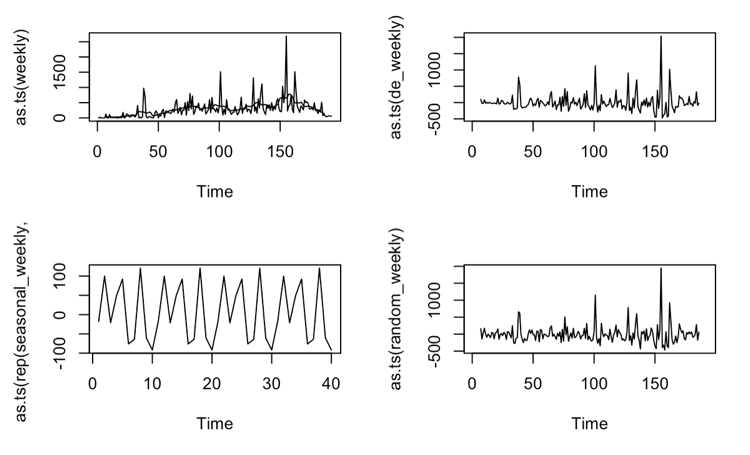
Decomposed Weekly work request data
Apply ADF test to the weekly dataset
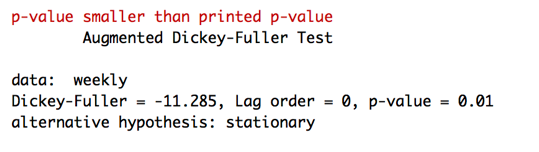
The p-value is smaller than 0.01. We reject the null at 1% significant level and conclude that the weekly dataset is stationary.
Plot ACF and PACF:
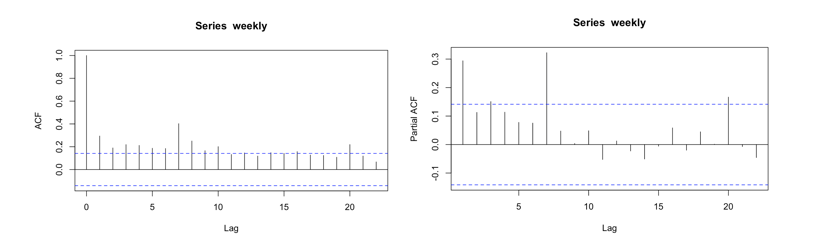
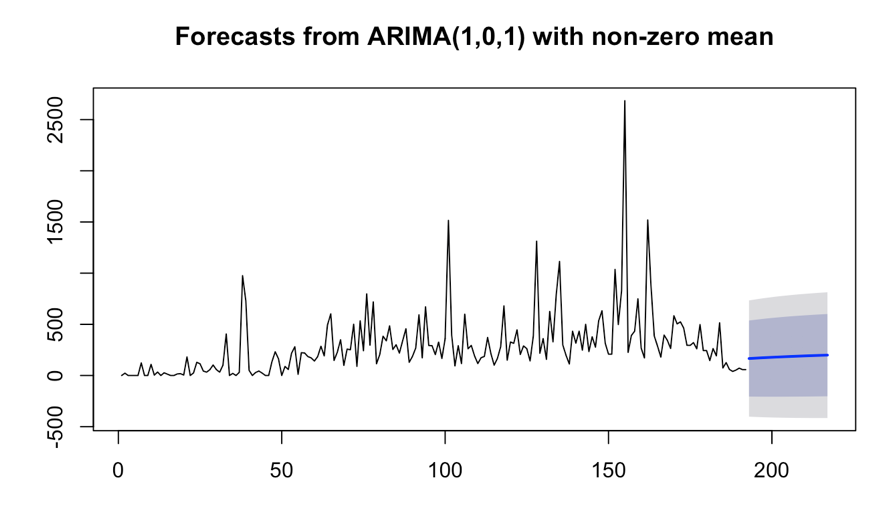
They both tail off. So use auto.arima() to find out the optimised p, d, q of the model
Result of auto.arima()

ARIMA(1,0,1) is applied for weekly data.
Forecast plot: